Automated Attendance (Placer.ai)
Automated Attendance (Placer.ai)
Overview Report
Metrics
Metrics provide key insights about a property or traffic pin based on the panel used to estimate performance during the report's selected date range.

The following metrics are provided:
- Visits: The extrapolated number of visits at the property.
- Visits / sq ft: The number of visits at the property by its size (square footage).
- Size / sq ft: The property's square footage is based on the polygon's size when individual properties are analyzed, and Gross Leasable Areas (GLA) when shopping centers are examined.
- Audience: The extrapolated number of individual visitors, or people in your selected audience group, who visited the property. Click here to learn more about Audience Types.
- Visit Frequency: The average number of visits per person in the selected audience group in the selected date range. This helps you understand how often people are returning to a location.
- Avg. Dwell Time: The average amount of time spent by people in your selected audience group at the property during a visit.
- Panel Visits: The number of visits generated by panel devices (the unique number of mobile devices that visited the location examined).
- YoY: The percent change in visits during the report's date range relative to the same period in the previous year. i.e. A report for July - August 2021 will be compared to July - August 2020. *
- Yo2Y: The percent change in visits during the report's date range relative to the same period two years ago. i.e. A report for July - August 2021 will be compared to July - August 2019. *
- Yo3Y: The percent change in visits during the report's date range relative to the same period three years ago. i.e. A report for July - August 2021 will be compared to July - August 2018. *
- YOY compares a week to the previous year using ISO 8601 **(a standardized way of presenting date, time, and other period intervals) and it will be compared to the same week number the year before. Weeks are numbered from 1 to 52 annually.
Visits Trend
The Visits Trend indicates visitation performance over time to a property, during the selected time period. The following parameters can be examined:

Metrics
- Visits: The extrapolated number of visits at the property.
- Visits / sq ft: Visitation relative to the total square footage of the property examined. Click here to learn about how square footage is calculated.
- Baseline Change: This data enables you to take the average of the report time period and compare each day/week/month to that average.
- Panel Visits: Are the observed unique number of mobile devices that visit a location being examined (forming a Panel).
Aggregation
Visitation data can be viewed on a daily, weekly, or monthly period aggregation.
Annual Summary
Analyze the trend data at a high level and see if changes in the trend line were impactful at the macro level. A column chart will emerge showing data from 4 time periods (the Last 12 Months, the Previous Year, 2 years ago, and 3 years ago) allowing you to compare any changes in the data.
Outlier Indicators
Highlight the days with an irregular number of visits (either high or low) relative to that day’s expected performance (based on an algorithm examining the visits trend and its year-over-year values)
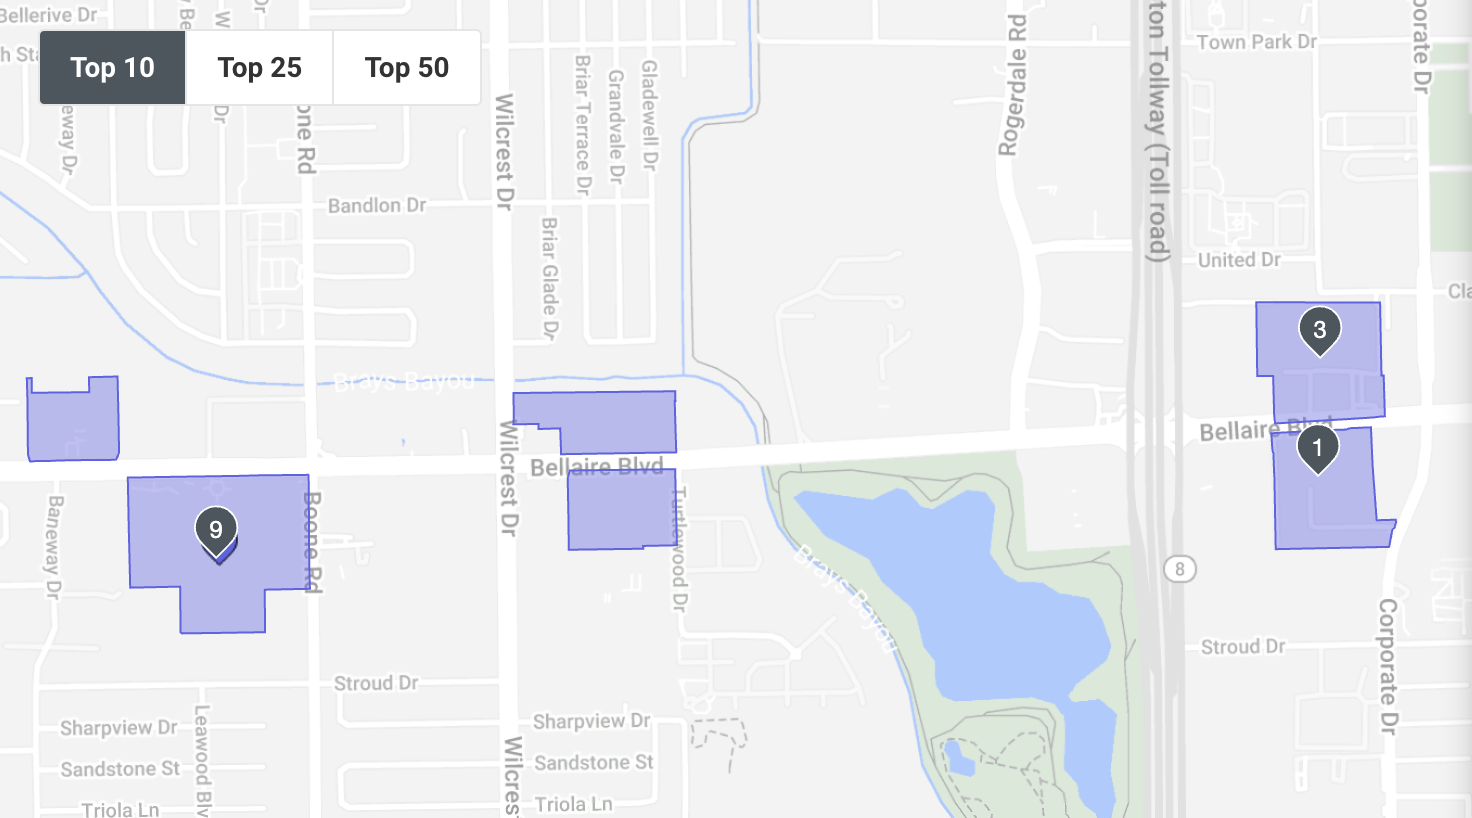
Market Landscape
Market Landscape is a multi-layered map that allows you to analyze the area around a property using several data layers:

- Properties layer: Displays all the properties that surround a specific venue to examine competing locations and assess the local landscape.
- Trade Area layer: Visualizes where visitors come from, by home or work location, to identify the pockets that generate visitation per different trade area types.
- Vehicle Traffic layer: Presents daily traffic volumes at different road segments near the property analyzed to assess the impact of traffic on visitation.
Market Landscape can be configured to display the different data layers in any combination to provide a holistic view of the local environment.
Map Configurations:
The map can be customized to display different styles and labels. In "Edit" mode you may reposition property labels or hide them from the map.
The map view can be exported in either PDF or PNG format. The properties shown on the map can be exported in a CSV, including their address, visits, ranking, and distance from the analyzed POI.
Audience Overview
Audience Overview provides a snapshot of audience demographics in the trade area of the property examined to assess the typical attributes of the population in the Captured or Potential Market.

You may assess audience attributes by several parameters including:
- Dataset: Select which 3rd party dataset you’d like to use to analyze audience attributes. Supported datasets include STI Popstats, Census 2017, 2019, 2020, 2021, and 2022.
- View: Select the market for which you would like to display audience attributes. Choosing Captured Market will focus on the demographics of property visitors, while Potential Market will highlight the demographics of the wider population in the property's trade area. You may also compare the attributes of the population in both the Captured and Potential Markets. Click here to learn more about Captured and Potential Markets.
- Compare to: Select whether to benchmark audience attributes to the attributes of the population in the selected property’s state and/ or the entire United States (both can be selected).
The table displays a breakdown of supported audience attributes, including:
- Median Household Income: The median dollar value of income per household in the market examined.
- Bachelor’s Degree or Higher: The percentage of the population in the selected market with higher education.
- Median Age: The median age in the market examined.
- Most Common Ethnicity: The ethnicity that represents the highest percentage of the population in the market selected.
- Persons per household: The average number of individuals per household.
Clicking on each of the audience attributes will display a bar chart indicating the distribution of that attribute in the population examined. The chart will also display the compared group(s) selected to show how the property's audience compares to the population nationwide or within the property's state. The chart can be displayed using numbers or percentages. Hovering over the chart will display additional details.
Ranking Overview
Ranking Overview provides a snapshot of a property's rank over a specific period of time, based on the following parameters:

Benchmark
- Within the Category Group
- Within the Category
- Within the Chain
Each metric is benchmarked relative to the group selected (category group, category, or chain) and is broken down by region:
- Nationwide: The property’s rank relative to others across the United States.
- State/CBSA/DMA: The property’s rank relative to others in the same state/DMA/CBSA.
- Local: The property’s rank relative to others within a 5/10/15/30/50 miles radius
You may analyze a property’s ranking using different metrics and with respect to different region types (nationwide, state, specified local mile radius). The following metrics can be examined:
Metrics
- Visits: Shows the property’s rank based on the total number of visits to the property.
- Visits / Sq ft: Shows the property’s rank based on the number of visits relative to the total square footage of a property.
- Sales: Shows the property’s rank based on the total amount of sales generated at the property.
- Sales / Sq ft: Shows the property’s rank based on the total amount of sales generated at the property relative to the total square footage of a property.
- Transactions: Shows the property’s rank based on the total amount of transactions, which took place at the property.
Favorite Places
Favorite Places provides a list of other local places that visitors to a certain property, or location, have also **visited during the selected time frame (i.e., "X% of visitors to my property also visited 'property Y' during the last Z months").


The list of Favorite Places can be filtered by industry categories to assess customer buyer behaviors by location type. You may also set a minimum visit frequency (Min. Visits) to display the favorite places visited at least a certain number of times during the report's date range. This data can identify customers' brand preferences across different consumer categories, and help determine the best fit retailers based on customers' other places of interest.
The visitors to the selected POI are determined by the report's visit duration. When the report's visit duration is changed, this affects the overlapping number of visitors between the POI and the proposed favorite places, meaning the favorite places you see may vary. The favorite places presented are based on their own default durations and changing the report’s default does not affect this.
Favorite Places displays the distance from the property examined in the report by aerial distance and does not account for driving or walking conditions.
Visitor Journey
Visitor Journey visualizes the flow of visitation activity to and from any property in the U.S. by showing the top "Prior" and "Post" locations. This allows you to identify the locations and brands that visitors visit before and after your selected POI. The percentages show the share of visitors who visited a particular location before or after the analyzed POI. You can choose to view visitation by Location, Category, or Category Group, as well as click on the “Show Home/Work” button to toggle on or off the home and work percentages.

The sum of Prior or Post visits might not always total 100% of the property visits. Several factors may lead to the exclusion of prior or post visitation data:
- Prior/Post visits for enclosed properties: In places like Las Vegas, where stores are often enclosed within large hotels and casino complexes, determining the stores’ visitor journey can be challenging. In these cases, and upon request, the Placer.ai Support Team can adjust visit detection to include the entire enclosing property as a prior or post location.
- Prior/Post visits for sensitive/restricted locations: Placer.ai does not expose location data for sensitive locations (i.e., military facilities, government buildings, schools, etc.) or visits to locations where the signal is not enough to report on (i.e., dense urban spaces, multi-story buildings, etc.). In these cases, the gap in Prior and Post visits cannot be mitigated by the Support Team.
Visitor Journey - Routes
Visitor Journey - Routes shows vehicle traffic routes to and from any property. Uncover the properties and brands that customers go to before and after visiting another property based on their travel paths.
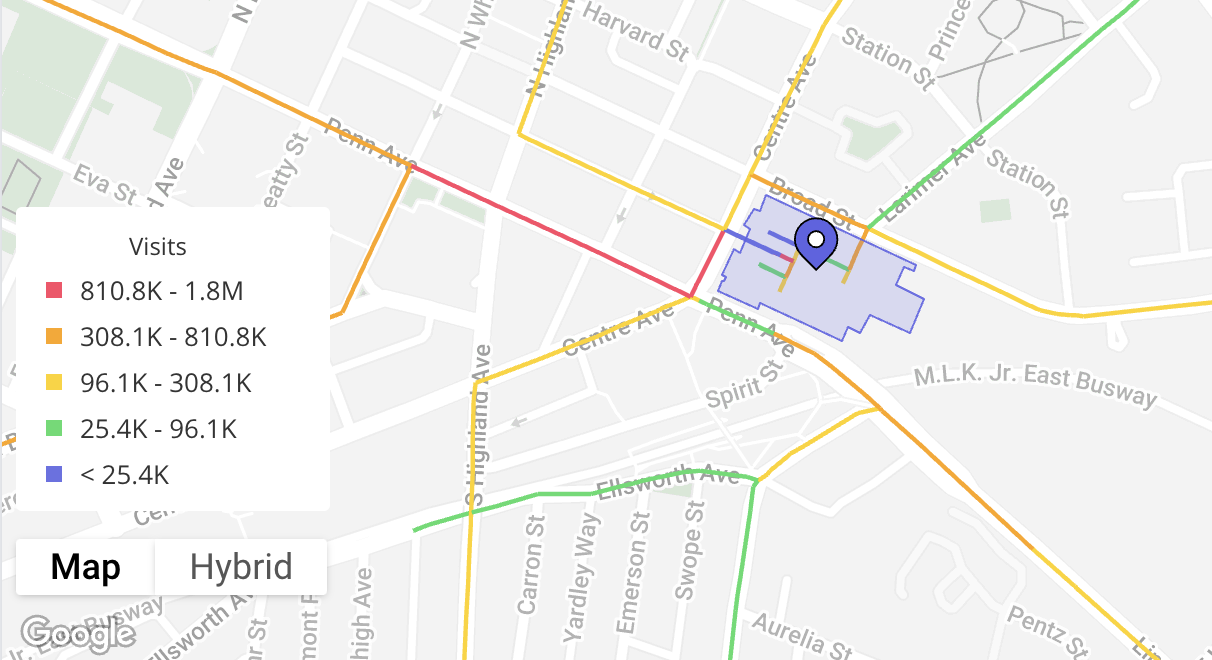
The "Journey Direction" parameter allows you to adjust the direction of the data in the map. Select to visualize routes either "To Property" or "From Property".
The purple routes (indicating roads with the lowest visitation range) do not indicate where visitor journeys start or end. These routes are cut and adjusted to protect individuals’ privacy and ensure anonymity. They do not represent the home locations of the visitors. Please note that the legend adjusts according to the report's date range.
Hourly Visits
Hourly Visits shows the total number of visits to a property at any time of day during the selected date range.

The following metrics can be examined:
Metrics
- Visits: The total number of visits to the property broken down by the hour of the day.
- % of Visits: The percentage of visits broken down by the hour of the day, out of the total visits to the property.
Note:
Visitors often stay at locations for multiple hours at a time. When looking at the "Hourly Visits" data, it is important to note that a single visit may be included in multiple different hours of the day. For instance, if a person is at a location for 3 hours beginning at noon, a visit will appear under the 12 pm hour mark, the 1 pm, and the 2 pm. Therefore, in order to understand unique visits you can refer to the "Visitor" metrics for the location.
Daily Visits
Daily Visits presents the distribution of visitation throughout the week (Monday - Sunday). The following metrics can be examined:

Metrics
- Visits: The total number of visits to the property broken down by each day throughout the week.
- % of Visits: The percentage of visits broken down by each day throughout the week, out of the total visits to the property.
Visit Duration
Visit Duration indicates the amount of time, in minutes, that a visitor spends at a location. The chart shows a breakdown of visits by dwell time ranges (i.e., 15-29 minutes, 30-44 minutes, etc.). This breakdown can be viewed by total number of visits or percentage (%) of visits.

You can view the following metrics:
Metrics:
- Visits: The total number of visits to the property broken down by dwell time ranges.
- % of Visits: The percentage of visits broken down by dwell time ranges, out of the total visits to the property.
Visit Duration can also be viewed as average or median values:
- Average Stay: The average dwell time during the report’s date range.
- Median Stay: The middle dwell time value of the report’s date range where half of the visits were less than that value and half of the visits were more than that value.
Note:
The methodology for Visit Duration counts every time a visitor visits a location, which can be multiple times per day, while Total Visits counts each individual who visits a location once per day. Visitors who visited a location more than once a day will be included in multiple time slots (dwell time ranges) for that day, meaning the overall number of visits in the Visit Duration data may show higher levels of visitation.
For example, if someone visits a place for 20 minutes, leaves for over an hour, and comes back for 45 minutes, Visit Duration will count this as two visits, however, Total Visits will count this as just one visit.
Audience Profile
Audience Profile provides a variety of demographic and psychographic insights about property visitors and the population living within its trade area, based on a variety of 3rd party datasets that are available on Placer's Marketplace. Audience Profile presents a diverse range of demographic and psychographic attributes ranging from household income, age, and gender, to lifestyle preferences, spending patterns, and more - per the datasets enabled in your account. To learn more about the datasets available in Audience Profile and the insights they provide, please visit Placer's Marketplace.
View
You may view a property's audience by Captured or Potential market to assess the attributes of visitors in its captured market, or those of the wider population in the potential market. Audience Profile also allows you to compare both markets in order to assess visitor conversion and the specific attributes of the audience in each market. Click here to learn more about the methodology used to derive the Captured and Potential Markets.
Based On
Select the trade area type to base your analysis on. The trade area selected will define which Census Block Groups (CBGs) will be included in the analysis. The demographic and psychographic data shown is based on the CBG level and therefore the trade area selected will define which audience attributes will be shown. Note that you may select multiple trade area types to compare multiple trade area methodologies side-by-side (supported only when examining a single property). The trade area types you can base your analysis on are:
- True Trade Area: Represents the trade area derived from the actual volume of visitors that visited the property, per the % of Visits thresholds defined. By default, you will see 30%, 50%, and 70% visit volume thresholds pre-populated to capture the core visitation to the property. A visit volume of 100% would consider everyone who visited the location during the report's date range including tourists and other transient visitors, while a smaller % of visits can give a clearer picture of the visitors that most frequently go to the location.
- Polygon: A polygon is generated based on the percentage of visits within a mile boundary. You may define % of Visits and define the mile range for which visitors are examined. For example, if the % Visits is set to 70% the polygon generated will include the home locations of the visitors that make up the top 70% of visits within the set mile limit. The “Within” box allows you to define the maximum mile distance of visits to include.
- Census Block Group (CBG): Directly leverages visitors' home locations to collect all of the Census Block Groups that generated visitation, regardless of the distance from the home location to the property. You may define % of visits for which visitors are examined. For example, if the % Visits is set to 70%, the trade area displayed will reflect all the Census Block Groups that make up the top 70% of visits. The “Within” box allows you to define the maximum mile distance of visits to include.
- Drive Time: Represents the trade area derived by the trip duration (in minutes) required for visitors to drive to the property. This trade area type does not currently account for traffic conditions.
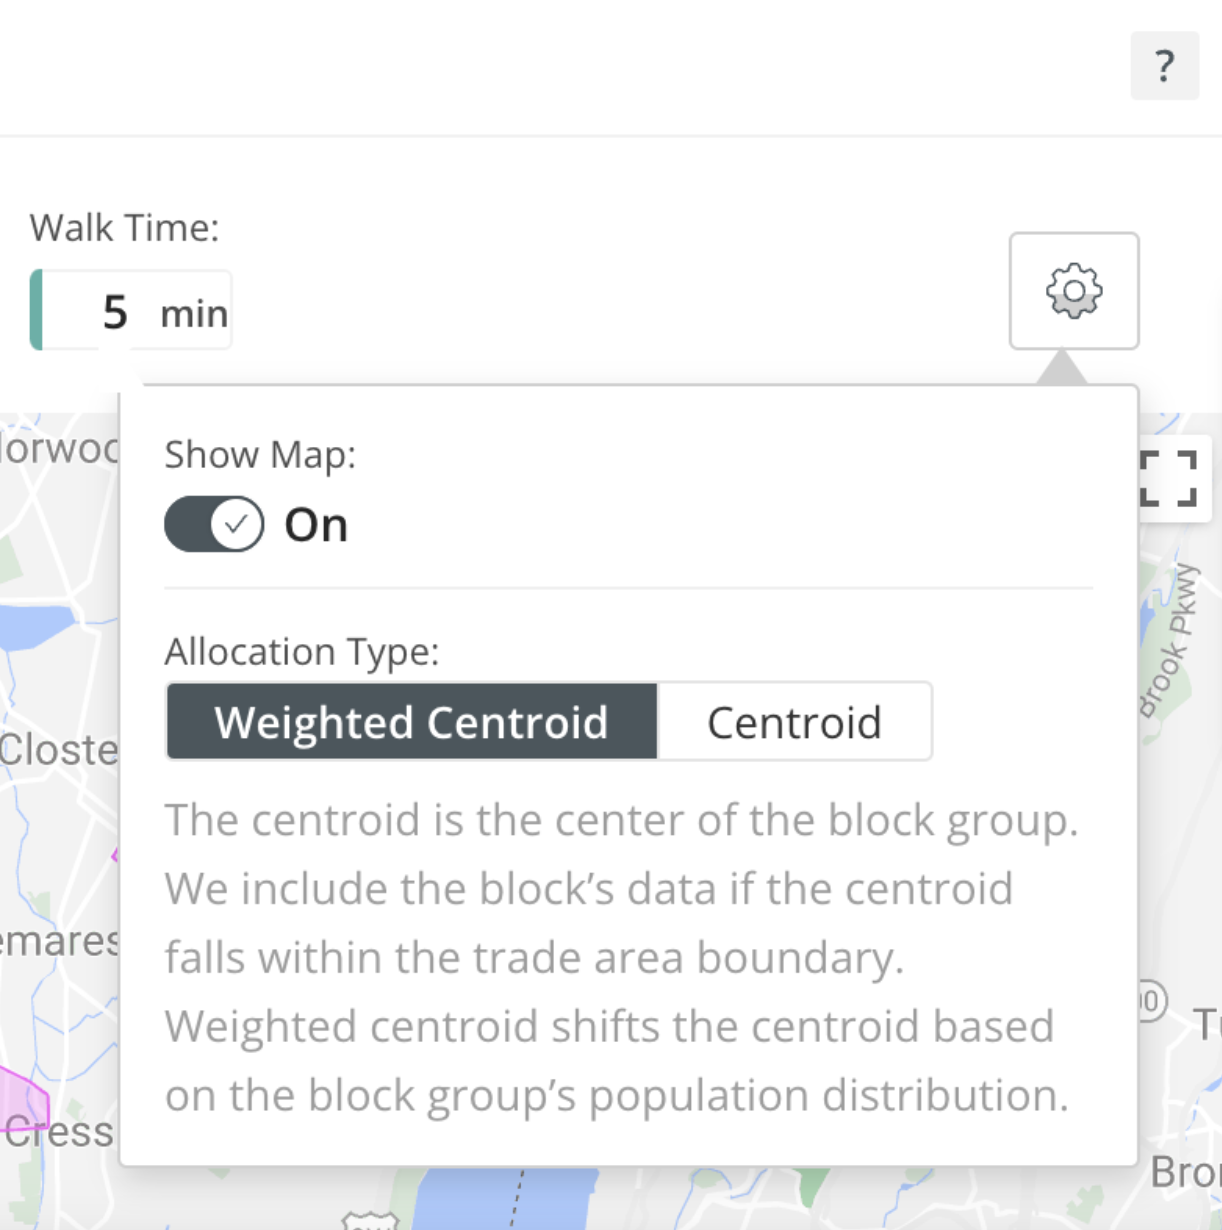
- Walk Time: Represents the trade area derived by the trip duration (in minutes) required for visitors to walk to the property. This trade area type leverages an estimated walking speed to reflect the average pace.
- Distance in Miles: Presents the trade area by a defined radius (in miles) around the property.
In the settings button, you may select to view the map allocation types by "Weighted Centroid" or "Centroid". This will not affect the map view, however, will adjust the metrics pulled into the dataset. These options determine if a census block should either be included in the trade area or not. "Weighted Centroid" pulls the middle of the census block (i.e., centroid) toward where the population is located in that census block, and if this falls inside the trade area boundary line then the census block will be included in the data. If the centroid is pulled to the population center in the census block, which rests outside the trade area boundary line, then the census block will not be included in the metrics. Overall, the "Weighted Centroid" more accurately represents where the location of people is concentrated within a block group. For example, a census block group in a rural area with wide farmlands. In this instance, you might want to use "weighted centroid" to more accurately capture where the population lies within the block group.
Interpreting the Dataset
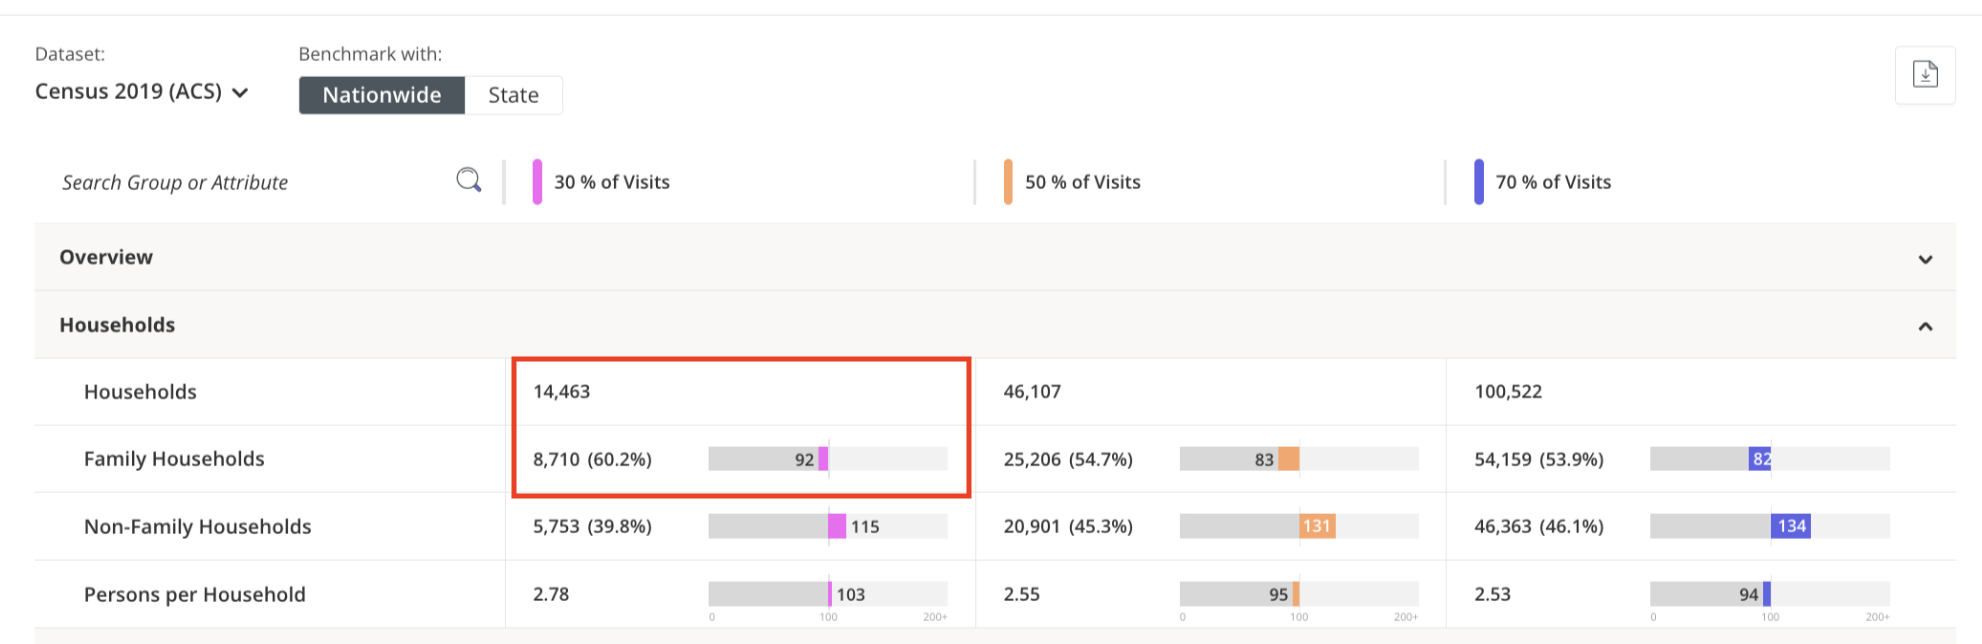
Each dataset has tables. The tables have groups that present a value, a percentage, and an index number (for each attribute/row). An index compares the value or percentage to a benchmark. The benchmarks we support today are state and nationwide. Therefore, a number above average (over-indexing) or below average (under-indexing) will give you an understanding of how your location's trade area compares to the benchmark you selected.
In the example below, when looking at the pink trade area (of the potential market view), you see the group named "Households". Next to this group, there is the number, showing that this trade area has 14,463 households. Of those 14,463 households, 8,710 represents the number of family households in this trade area. Family households represent 60.2% out of the entire number of households in the trade area.
92 is the index, which represents the comparison of the 60.2% of households in the trade area to the national average of family households in the U.S. An index of 100 means that the trade area attribute matches the national average. By looking at the index score, you will see that this attribute is under-indexed, meaning family households make up a smaller percentage of this trade area than the national average. Another way of putting it is 92 means that the proportion of family households in the trade area is 8% less than the national average (that there are fewer family households in this group being examined relative to the U.S.).
Click here for more information about the difference between households and population metrics used within the datasets.
Dataset Example
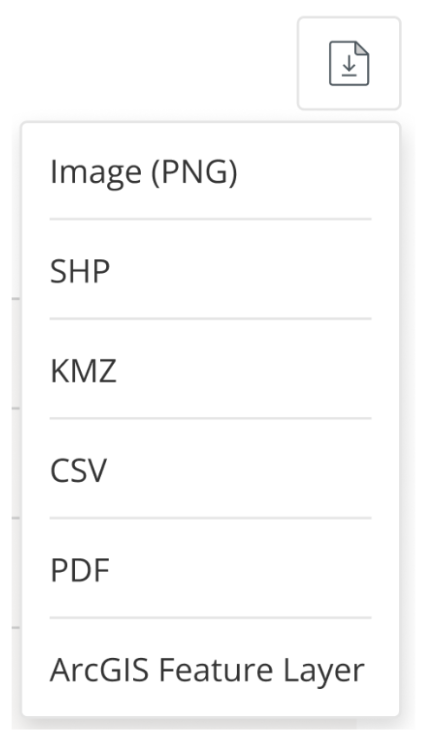
Data can be exported from the following options - Image (PNG), SHP, KMZ, CSV, PDF, or ArcGIS Feature Layer.
ArcGIS Feature Layer allows you to export trade areas from Audience Profile directly to your Esri account. Once selected, a popup will prompt you to "View in ArcGIS Content," opening Esri in a new tab to access the export under "My Content" after logging into your account. Up to 8 locations can be selected in a single export. *
Click here to view Audience Profile at the chain level.
Note:
Customers may find different datasets in Audience Profile depending on the account’s subscriptions. The Census 2017, 2019, 2020, 2021, and 2022 datasets are provided to all customers at no extra cost. Customers with paid subscriptions will also have access to STI: Popstats, STI: Spending Patterns, STI: Market Outlook, STI: Workplace, Experian Mosaic and AGS: CrimeRisk at no extra cost. A variety of additional datasets are available on Placer's Marketplace for an additional fee.
“Audience Profile” can be found in the "Demographics Report” under the "Property" section.
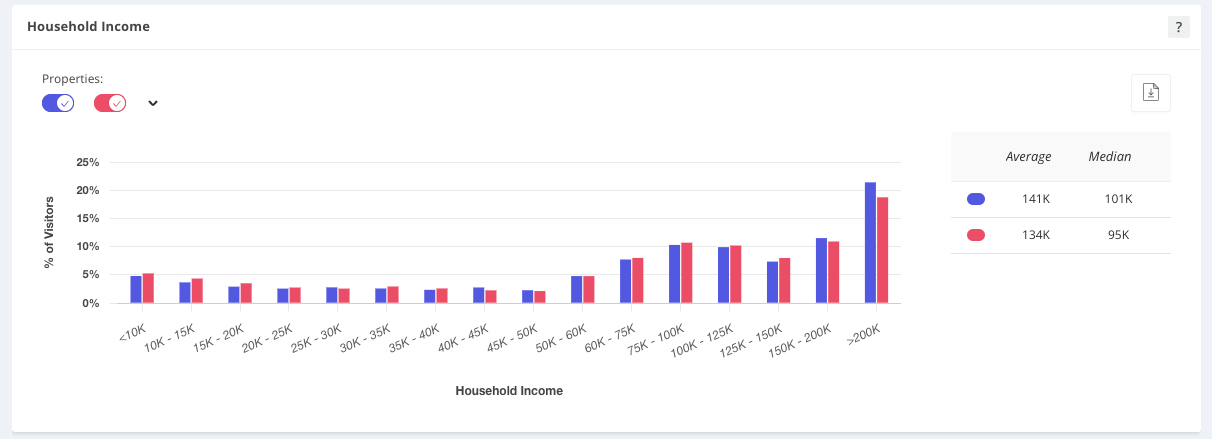
Household Income (HHI)
Household Income presents the average and median household income levels of visitors using several income range groups. The data displayed in Household Income pertains to visitors by their home origin and leverages Census 2022 data at the Census Block Group level.
Note:
The data displayed in Household Income reflects the property's Captured Market based on True Trade Area capturing 70% of visits with a Census Block Group boundary type.
“Household Income (HHI)” can be found in the "Demographics Report” under the "Property" section
Ethnicity
Ethnicity provides a breakdown of the ethnic groups that characterize a property's audience based on data provided by Census 2022. The data reflects the population in the property's Captured Market and therefore, emphasizes the attributes of visitors.
Ethnicity displays a breakdown of several ethnic groups, including:
- White
- Black
- Hispanic
- American Indian
- Asian
- Pacific Islander
- Other (indicating an ethnicity not listed above)
- Two or more (indicating a combination of ethnicities)
Note:
The data displayed in Ethnicity reflects the property's Captured Market based on True Trade Area capturing 70% of visits with a Census Block Group boundary type.
“Ethnicity” can be found in the "Demographics Report” under the "Property" section.
Updated on: 14/01/2026
Thank you!